


Execution quality
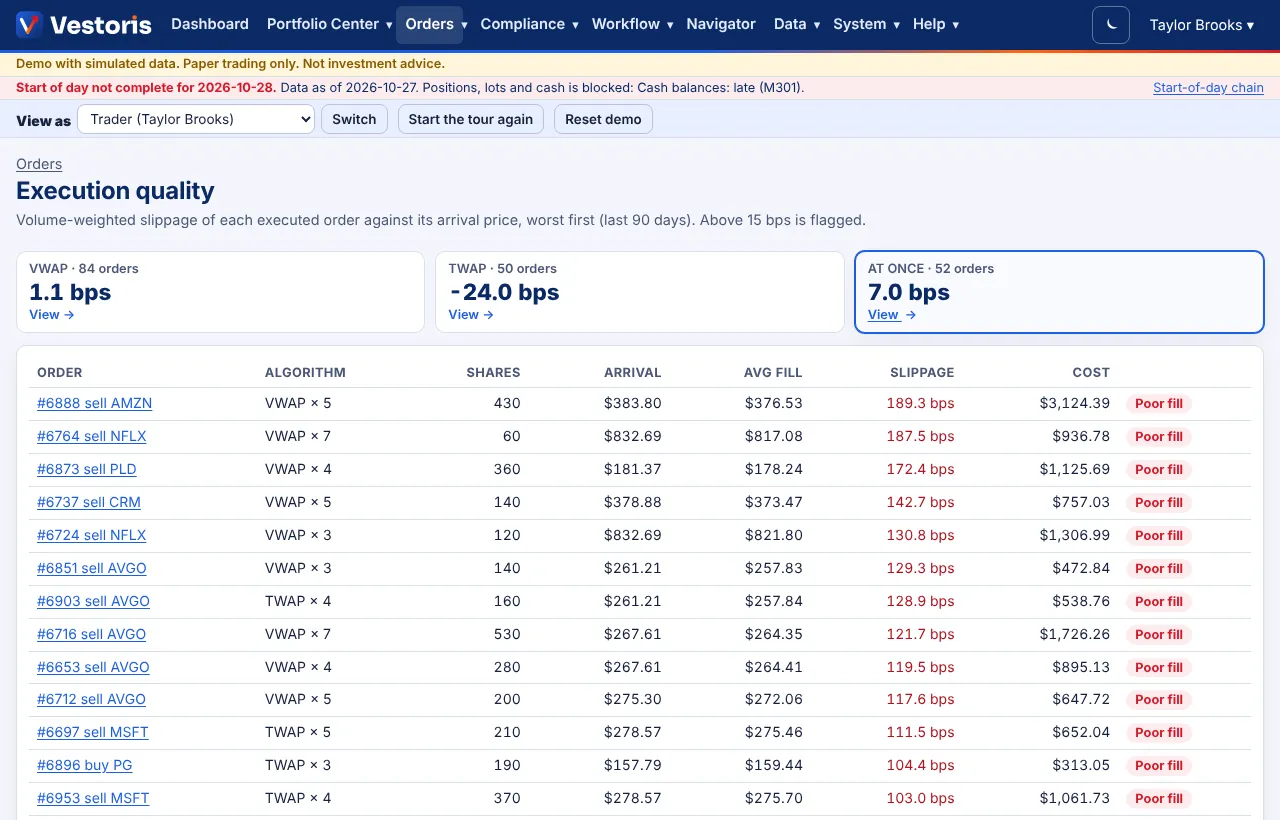
Volume-weighted slippage of each executed order against its arrival price, by algorithm, worst first.
At a glance
- Where
- Orders › Execution quality (
/app/orders/quality) - Who
- Everyone who can see orders; Traders use it most. Roles and permissions
Try it in the demo A private sandbox firm, no sign-up. Simulated data only.
What it shows
- One box per algorithm (VWAP, TWAP, All at once): the number of orders and their volume-weighted slippage. View → lists those orders.
- The orders of the last 90 days, worst first: algorithm and slices, shares, arrival price (the simulated price when it was released), average fill, slippage in basis points and the cost in dollars. Above 15 bps an order is flagged Poor fill.
How slippage is measured
Slippage = (average fill − arrival) ÷ arrival, in basis points, signed so that a positive number is worse for you (paying more on a buy, receiving less on a sale). The fills are simulated against the half-hour price buckets of each security's simulated day, with spread and market impact; larger orders relative to average daily volume cost more.
What to do with it
- Re-plan a working order's unfilled shares with another algorithm (Rework, or the blotter command "Move the VWAP orders for the Growth accounts to TWAP").
- Use more slices for orders that are large against the security's average daily volume.
- Save a blotter view with the slippage column and a colour rule ("Slip bps > 20 red").
Paper trading: fills are simulated, so the numbers show how the simulator behaves, not market execution.
Related articles
Do it with the API
Every action on this screen can also be done by your own systems, under the same permissions. See Authentication to get a token.
- GET
/api/v1/executionsSimulated fills on the accounts you can see - GET
/api/v1/orders/{id}/fillsSimulated fills of an order - POST
/api/v1/orders/{id}/reworkRe-plan a working order's unfilled shares with another algo
Paper trading only: orders and fills in Vestoris are simulated. Nothing here is investment advice.